The practice exam is not a real exam, but covers some (not all) of the concepts and questions that might be covered by the real exam (which is oral). If you have done a project some (0-50%) of the images or histograms will come from your project slides instead of random samples as it is now. The exam will generally not be multiple choice!
Practice Exam Questions
Quantitative Big Imaging
Kevin Mader
Practice Exam
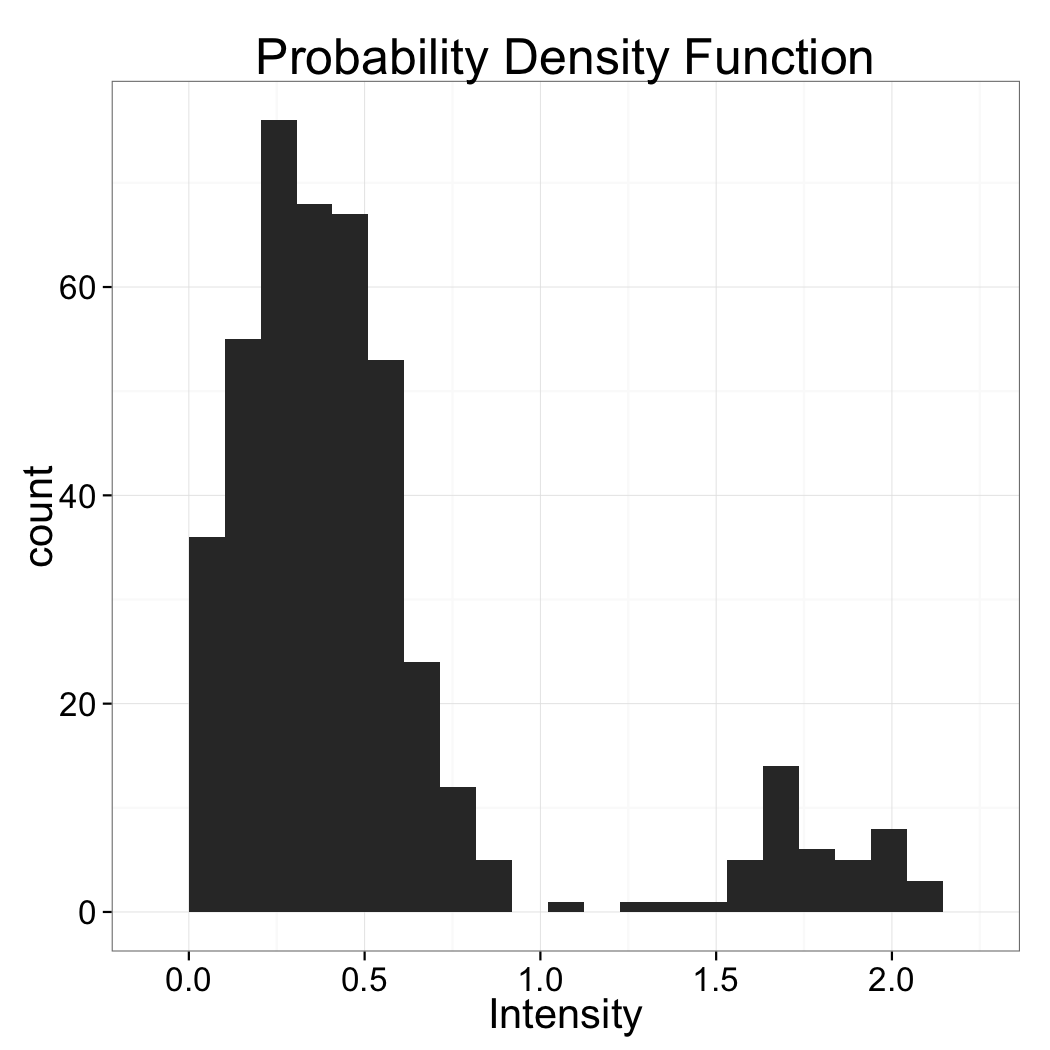
Choosing a threshold
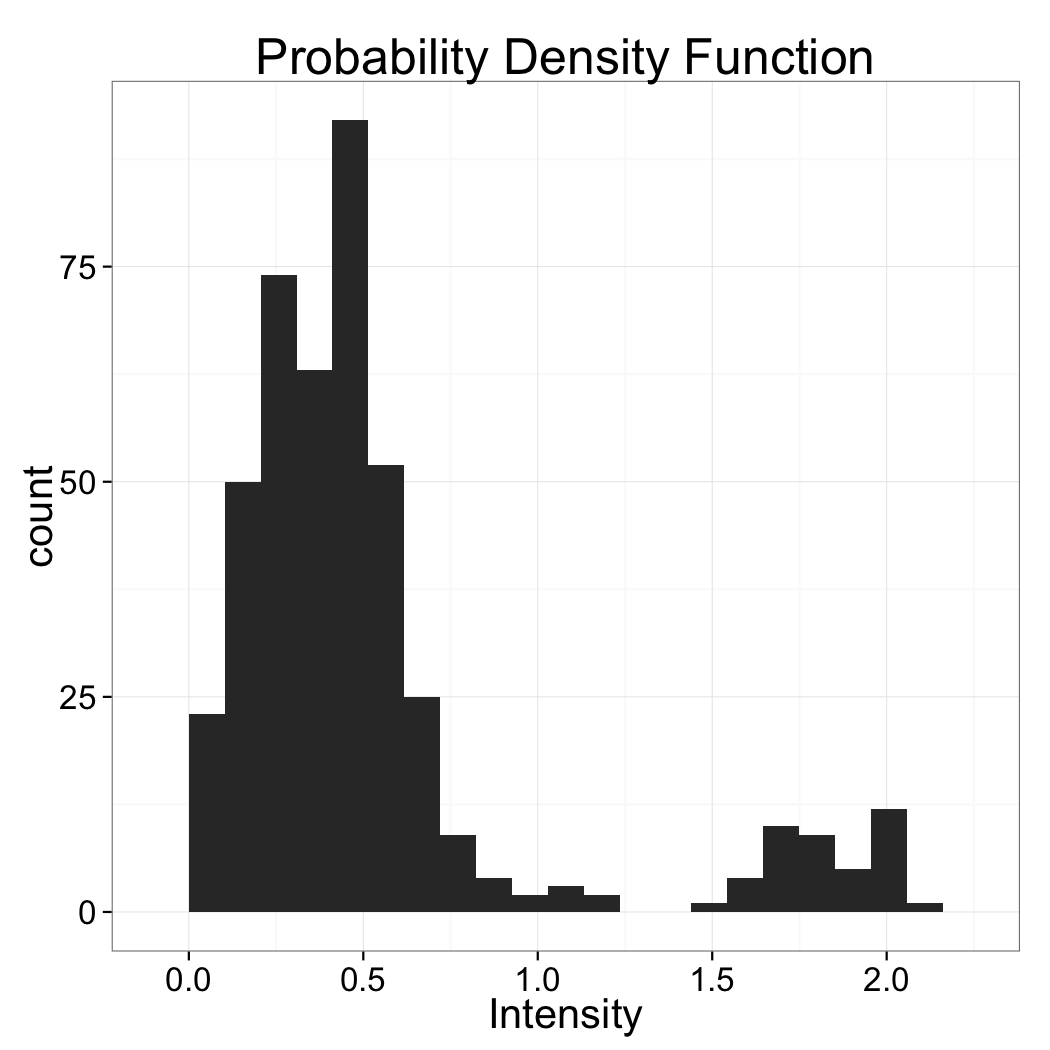
Based just on the distribution above which value would make the most sense for the threshold
Image Enhancement Speckled
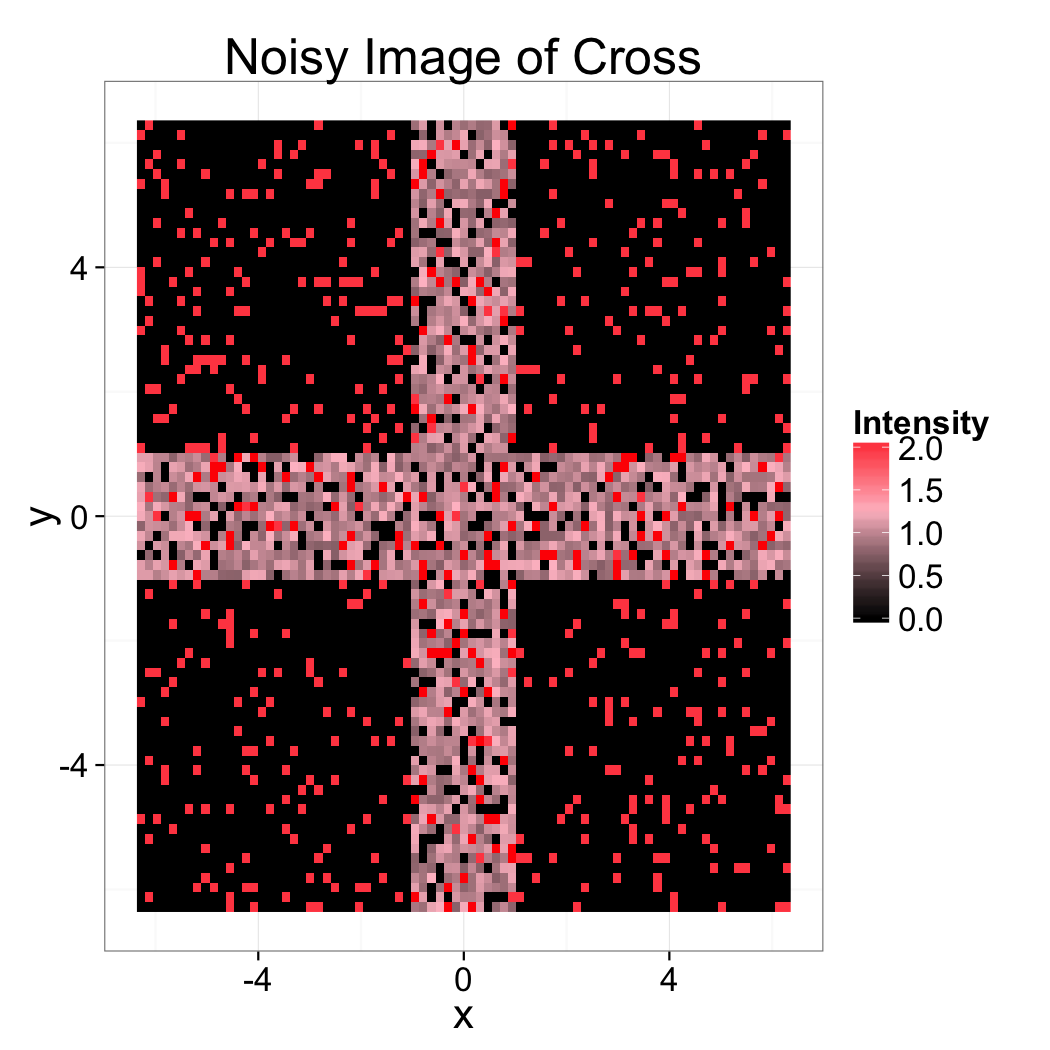
Given the following measured image of a sample of a cross, which filter would you expect to work best?
Image Enhancement Blurry
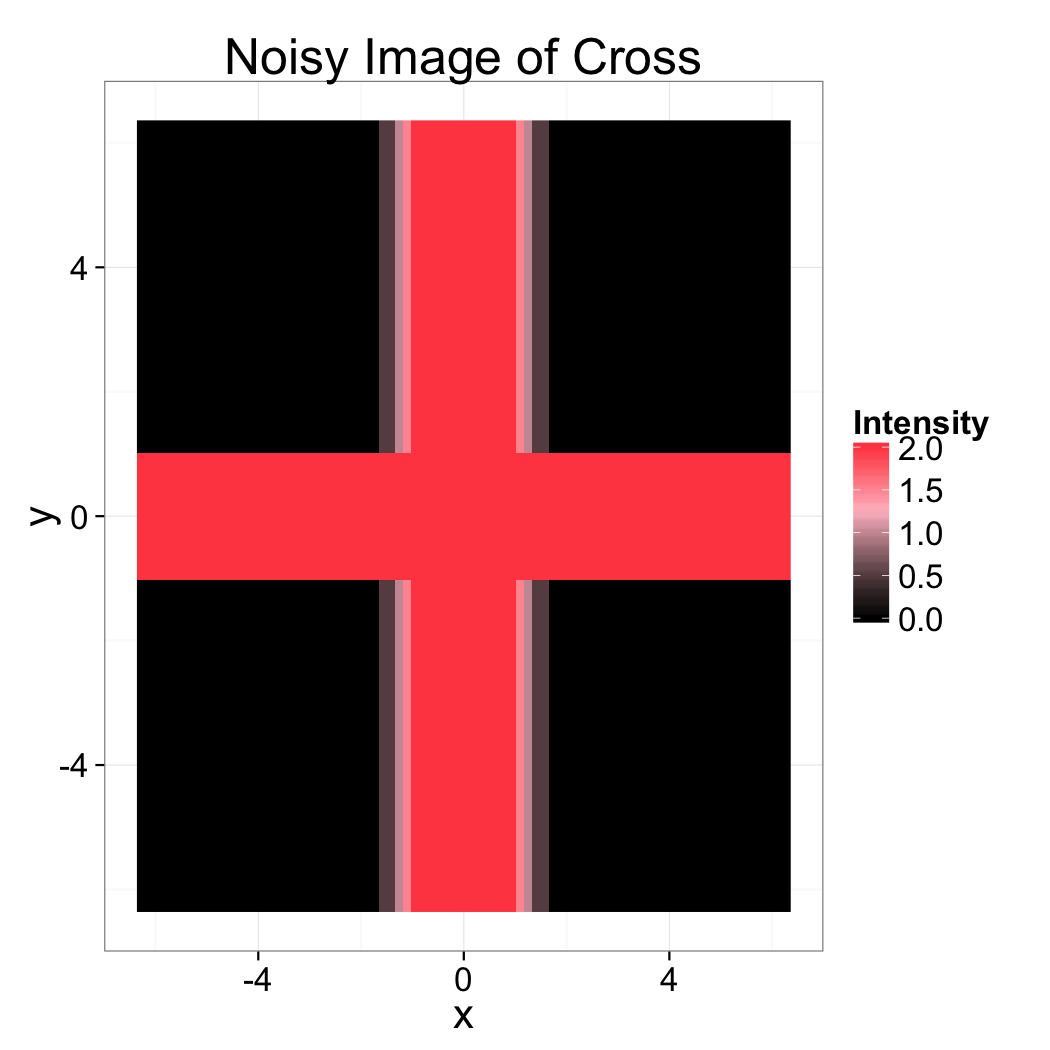
Given the following measured image of a sample of a cross, which filter would you expect to work best?
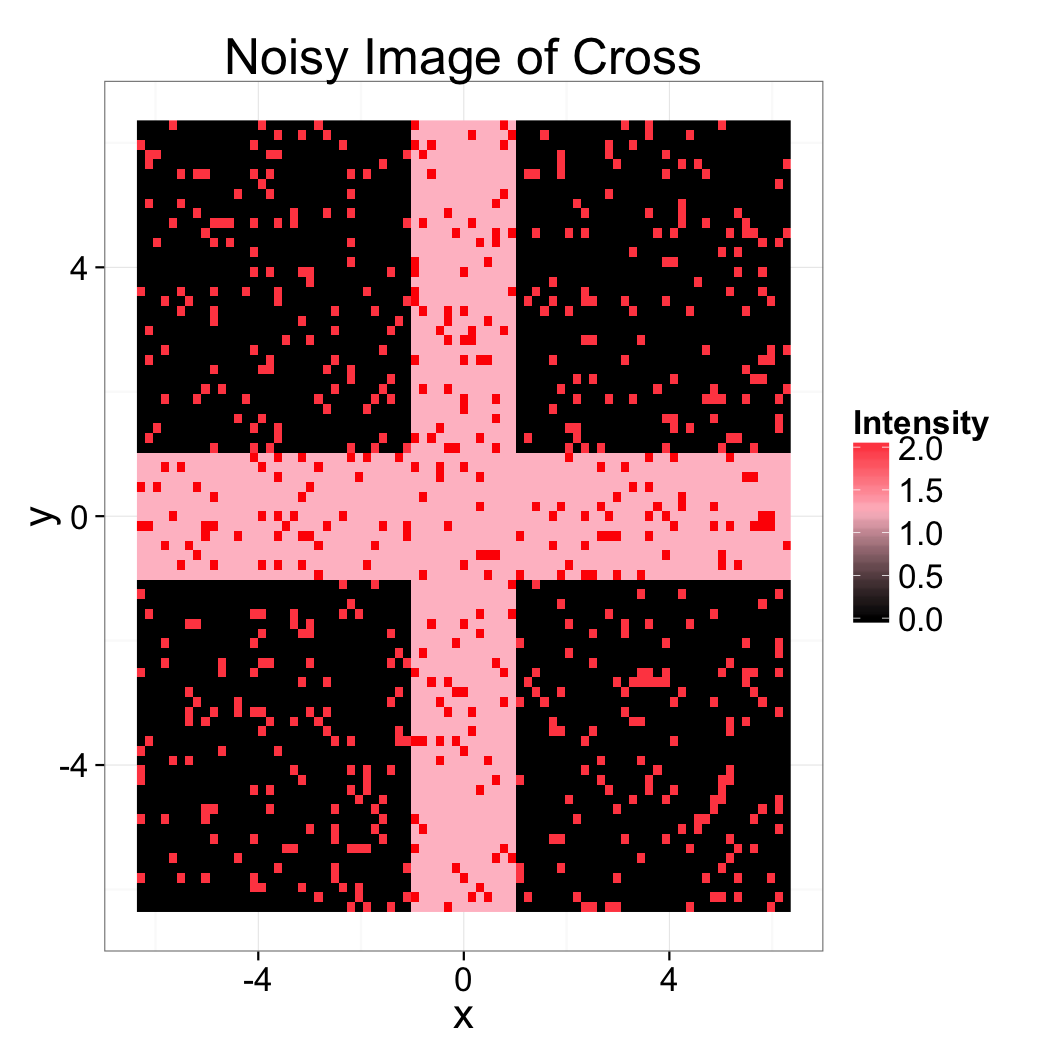
Image Enhancement Background

Given the following measured image of a sample of a cross, which filter would you expect to work best?
Image Enhancement Challenging Question
Given the following measured image of a sample of a cross, which filter would you expect to work best?
Morphological Operations

Looking at the before and after images, which morphological operation was most-likely performed and what was the range
Segmentation Strategy
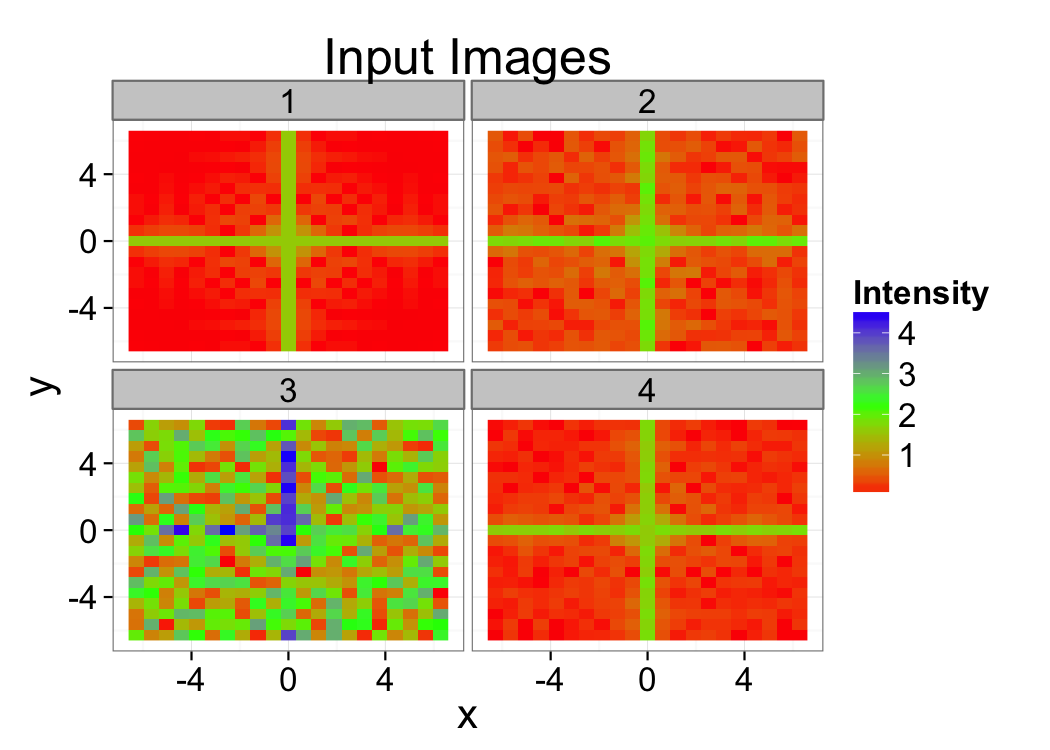
You measure the same cross 4 times and and get the following images as output. Estimate the signal to noise in the images and provide a strategy for how the data could be filtered and segmented.
Automatic Thresholds
Which is the best reason to use automatic threshold techniques on data


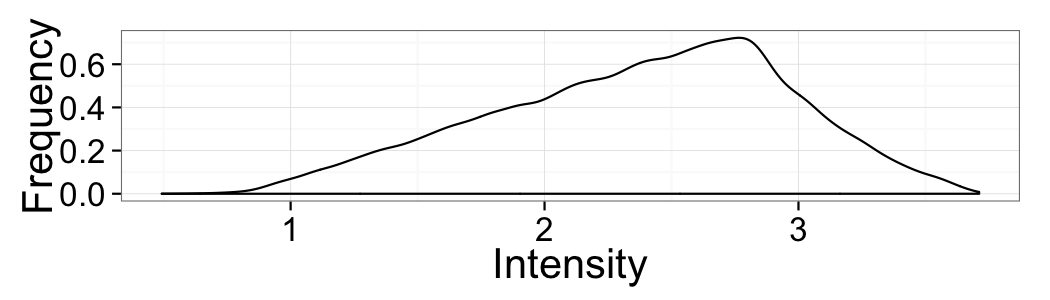
Selecting a threshold technique
Based soley on the histogram above which automatic threshold technique is best suited?
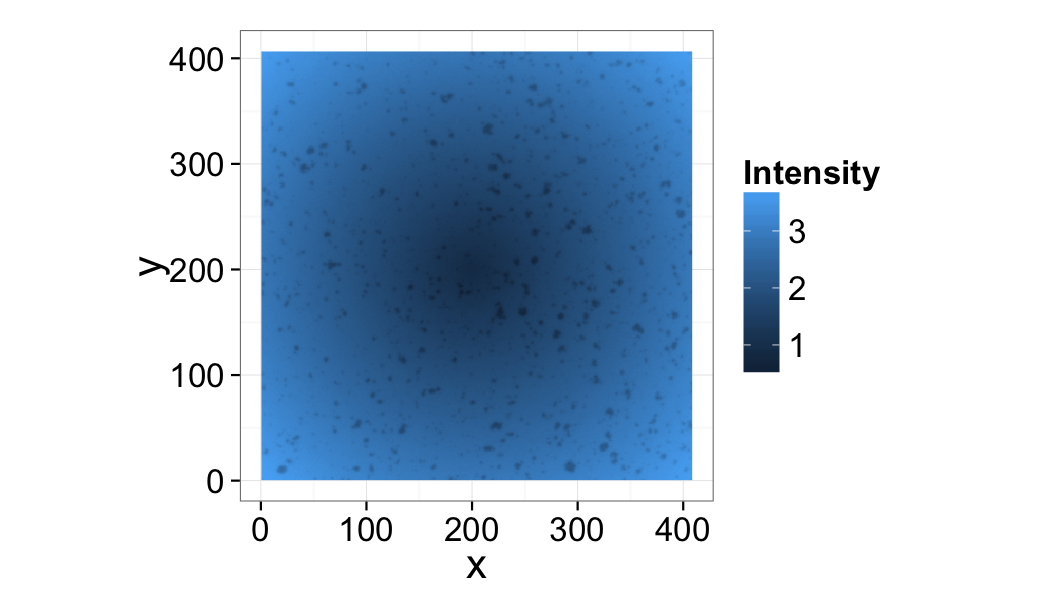
Applying Thresholds
Can a threshold be applied to this image? Why or why not?
K-Means Clustering
Which statement best describes the limitations and shortcomings of using K-means clustering
Shape Analysis Anisotropy
Explain what anisotropy means in reference to shape and explain why it might be useful when examining cells which are thought to be responsible for mechanosensation in bone?
Hint
The defitions of anisotropy is in the Analyzing Single Objects lecture and the mechanosensation requires you to think about how forces might interact with such a cell.
Shape Analysis Validation
Below is a segmented image of cells using two different thresholds. Each image is right in some ways (accurate cell shape and volume) and wrong in some ways (too many noise spots, etc)

How would you choose the best image and validate your method? What additional steps could be taken to further improve the segmented image?
Distribution Analysis
Below is a plot of object center of volume coming from the result of segmentation and shape analysis. Is there any emergent pattern in the positioning of these cells? Are the positions randomly distributed? Which metrics might be useful for further characterizing the randomness?
