Mining the Social Web, 2nd Edition

Chapter 3: Mining LinkedIn: Faceting Job Titles, Clustering Colleagues, and More

This IPython Notebook provides an interactive way to follow along with and explore the numbered examples from Mining the Social Web (2nd Edition). The intent behind this notebook is to reinforce the concepts from the sample code in a fun, convenient, and effective way. This notebook assumes that you are reading along with the book and have the context of the discussion as you work through these exercises.

In the somewhat unlikely event that you've somehow stumbled across this notebook outside of its context on GitHub, you can find the full source code repository here.

You are free to use or adapt this notebook for any purpose you'd like. However, please respect the Simplified BSD License that governs its use.

LinkedIn API Access

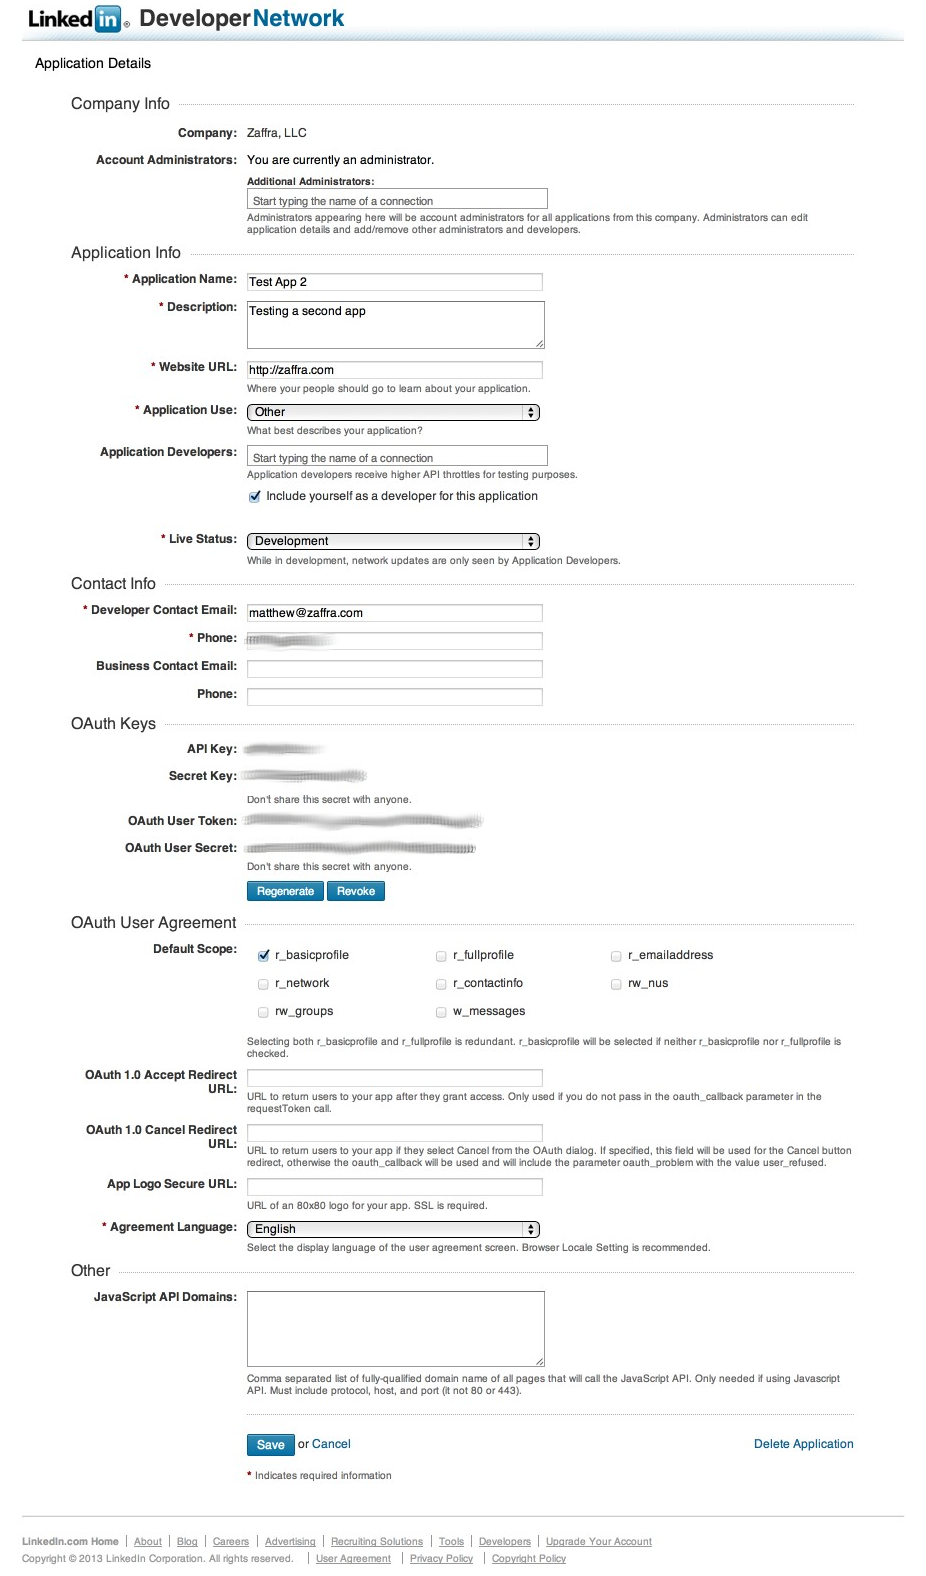
LinkedIn implements OAuth 2.0 as one of its standard authentication mechanisms, but still supports OAuth 1.0a, which provides you with four credentials ("API Key", "Secret Key", "OAuth User Token", and "OAuth User Secret") that can be used to gain instant API access with no further fuss or redirections. You can create an app and retrieve these four credentials through the "Developer" section of your account settings as shown below or by navigating directly to https://www.linkedin.com/secure/developer.

Note that you'll need to install a third-party package called python-linkedin to use the code in this notebook. Installing a package directly from a GitHub repository is easy with pip in the terminal:

pip install python-linkedin

Example 1. Using LinkedIn OAuth credentials to receive an access token suitable for development and accessing your own data

In []:
from linkedin import linkedin # pip install python-linkedin

# Define CONSUMER_KEY, CONSUMER_SECRET,  
# USER_TOKEN, and USER_SECRET from the credentials 
# provided in your LinkedIn application

CONSUMER_KEY = ''
CONSUMER_SECRET = ''
USER_TOKEN = ''
USER_SECRET = ''

RETURN_URL = '' # Not required for developer authentication

# Instantiate the developer authentication class

auth = linkedin.LinkedInDeveloperAuthentication(CONSUMER_KEY, CONSUMER_SECRET, 
                                USER_TOKEN, USER_SECRET, 
                                RETURN_URL, 
                                permissions=linkedin.PERMISSIONS.enums.values())

# Pass it in to the app...

app = linkedin.LinkedInApplication(auth)

# Use the app...

app.get_profile()

Example 2. Retrieving your LinkedIn connections and storing them to disk

In []:
import json

connections = app.get_connections()

connections_data = 'resources/ch03-linkedin/linkedin_connections.json'

f = open(conections_data, 'w')
f.write(json.dumps(connections, indent=1))
f.close()

# You can reuse the data without using the API later like this...
# connections = json.loads(open(connections_data).read())
In []:
# Execute this cell if you need to reload data...
import json
connections = json.loads(open('resources/ch03-linkedin/linkedin_connections.json').read())

Note: Should you need to revoke account access from your application or any other OAuth application, you can do so at [https://www.linkedin.com/secure/settings?userAgree=&goback=%2Enas_1_1_1](https://www.linkedin.com/secure/settings?userAgree=&goback=%2Enas1_11)

Example 3. Pretty-printing your LinkedIn connections' data

In []:
from prettytable import PrettyTable # pip install prettytable

pt = PrettyTable(field_names=['Name', 'Location'])
pt.align = 'l'

[ pt.add_row((c['firstName'] + ' ' + c['lastName'], c['location']['name'])) 
  for c in connections['values']
      if c.has_key('location')]

print pt

Example 4. Displaying job position history for your profile and a connection's profile

In []:
import json

# See http://developer.linkedin.com/documents/profile-fields#fullprofile
# for details on additional field selectors that can be passed in for
# retrieving additional profile information.

# Display your own positions...

my_positions = app.get_profile(selectors=['positions'])
print json.dumps(my_positions, indent=1)

# Display positions for someone in your network...

# Get an id for a connection. We'll just pick the first one.
connection_id = connections['values'][0]['id']
connection_positions = app.get_profile(member_id=connection_id, 
                                       selectors=['positions'])
print json.dumps(connection_positions, indent=1)

Example 5. Using field selector syntax to request additional details for APIs

In []:
# See http://developer.linkedin.com/documents/understanding-field-selectors
# for more information on the field selector syntax

my_positions = app.get_profile(selectors=['positions:(company:(name,industry,id))'])
print json.dumps(my_positions, indent=1)

Example 6. Simple normalization of company suffixes from address book data

In []:
import os
import csv
from collections import Counter
from operator import itemgetter
from prettytable import PrettyTable

# XXX: Place your "Outlook CSV" formatted file of connections from 
# http://www.linkedin.com/people/export-settings at the following
# location: resources/ch03-linkedin/my_connections.csv

CSV_FILE = os.path.join("resources", "ch03-linkedin", 'my_connections.csv')

# Define a set of transforms that converts the first item
# to the second item. Here, we're simply handling some
# commonly known abbreviations, stripping off common suffixes, 
# etc.

transforms = [(', Inc.', ''), (', Inc', ''), (', LLC', ''), (', LLP', ''),
               (' LLC', ''), (' Inc.', ''), (' Inc', '')]

csvReader = csv.DictReader(open(CSV_FILE), delimiter=',', quotechar='"')
contacts = [row for row in csvReader]
companies = [c['Company'].strip() for c in contacts if c['Company'].strip() != '']

for i, _ in enumerate(companies):
    for transform in transforms:
        companies[i] = companies[i].replace(*transform)

pt = PrettyTable(field_names=['Company', 'Freq'])
pt.align = 'l'
c = Counter(companies)
[pt.add_row([company, freq]) 
 for (company, freq) in sorted(c.items(), key=itemgetter(1), reverse=True) 
     if freq > 1]
print pt

Example 7. Standardizing common job titles and computing their frequencies

In []:
import os
import csv
from operator import itemgetter
from collections import Counter
from prettytable import PrettyTable

# XXX: Place your "Outlook CSV" formatted file of connections from 
# http://www.linkedin.com/people/export-settings at the following
# location: resources/ch03-linkedin/my_connections.csv

CSV_FILE = os.path.join("resources", "ch03-linkedin", 'my_connections.csv')

transforms = [
    ('Sr.', 'Senior'),
    ('Sr', 'Senior'),
    ('Jr.', 'Junior'),
    ('Jr', 'Junior'),
    ('CEO', 'Chief Executive Officer'),
    ('COO', 'Chief Operating Officer'),
    ('CTO', 'Chief Technology Officer'),
    ('CFO', 'Chief Finance Officer'),
    ('VP', 'Vice President'),
    ]

csvReader = csv.DictReader(open(CSV_FILE), delimiter=',', quotechar='"')
contacts = [row for row in csvReader]

# Read in a list of titles and split apart
# any combined titles like "President/CEO."
# Other variations could be handled as well, such
# as "President & CEO", "President and CEO", etc.

titles = []
for contact in contacts:
    titles.extend([t.strip() for t in contact['Job Title'].split('/')
                  if contact['Job Title'].strip() != ''])

# Replace common/known abbreviations

for i, _ in enumerate(titles):
    for transform in transforms:
        titles[i] = titles[i].replace(*transform)

# Print out a table of titles sorted by frequency

pt = PrettyTable(field_names=['Title', 'Freq'])
pt.align = 'l'
c = Counter(titles)
[pt.add_row([title, freq]) 
 for (title, freq) in sorted(c.items(), key=itemgetter(1), reverse=True) 
     if freq > 1]
print pt

# Print out a table of tokens sorted by frequency

tokens = []
for title in titles:
    tokens.extend([t.strip(',') for t in title.split()])
pt = PrettyTable(field_names=['Token', 'Freq'])
pt.align = 'l'
c = Counter(tokens)
[pt.add_row([token, freq]) 
 for (token, freq) in sorted(c.items(), key=itemgetter(1), reverse=True) 
     if freq > 1 and len(token) > 2]
print pt

Example 8. Geocoding locations with Microsoft Bing

In []:
from geopy import geocoders

GEO_APP_KEY = '' # XXX: Get this from https://www.bingmapsportal.com
g = geocoders.Bing(GEO_APP_KEY)
print g.geocode("Nashville", exactly_one=False)

Example 9. Geocoding locations of LinkedIn connections with Microsoft Bing

In []:
from geopy import geocoders

GEO_APP_KEY = '' # XXX: Get this from https://www.bingmapsportal.com
g = geocoders.Bing(GEO_APP_KEY)

transforms = [('Greater ', ''), (' Area', '')]

results = {}
for c in connections['values']:
    if not c.has_key('location'): continue
        
    transformed_location = c['location']['name']
    for transform in transforms:
        transformed_location = transformed_location.replace(*transform)
    geo = g.geocode(transformed_location, exactly_one=False)
    if geo == []: continue
    results.update({ c['location']['name'] : geo })
    
print json.dumps(results, indent=1)

Example 10. Parsing out states from Bing geocoder results using a regular expression

In []:
import re

# Most results contain a response that can be parsed by
# picking out the first two consecutive upper case letters 
# as a clue for the state
pattern = re.compile('.*([A-Z]{2}).*')
    
def parseStateFromBingResult(r):
    result = pattern.search(r[0][0])
    if result == None: 
        print "Unresolved match:", r
        return "???"
    elif len(result.groups()) == 1:
        print result.groups()
        return result.groups()[0]
    else:
        print "Unresolved match:", result.groups()
        return "???"

    
transforms = [('Greater ', ''), (' Area', '')]

results = {}
for c in connections['values']:
    if not c.has_key('location'): continue
    if not c['location']['country']['code'] == 'us': continue
        
    transformed_location = c['location']['name']
    for transform in transforms:
        transformed_location = transformed_location.replace(*transform)
    
    geo = g.geocode(transformed_location, exactly_one=False)
    if geo == []: continue
    parsed_state = parseStateFromBingResult(geo)
    if parsed_state != "???":
        results.update({c['location']['name'] : parsed_state})
    
print json.dumps(results, indent=1)

Here's how to power a Cartogram visualization with the data from the "results" variable

In []:
import os
import json
from IPython.display import IFrame
from IPython.core.display import display

# Load in a data structure mapping state names to codes.
# e.g. West Virginia is WV
codes = json.loads(open('resources/ch03-linkedin/viz/states-codes.json').read())

from collections import Counter
c = Counter([r[1] for r in results.items()])
states_freqs = { codes[k] : v for (k,v) in c.items() }

# Lace in all of the other states and provide a minimum value for each of them
states_freqs.update({v : 0.5 for v in codes.values() if v not in states_freqs.keys() })

# Write output to file
f = open('resources/ch03-linkedin/viz/states-freqs.json', 'w')
f.write(json.dumps(states_freqs, indent=1))
f.close()

# IPython Notebook can serve files and display them into
# inline frames. Prepend the path with the 'files' prefix

display(IFrame('files/resources/ch03-linkedin/viz/cartogram.html', '100%', '600px'))

Example 11. Using NLTK to compute bigrams

In []:
ceo_bigrams = nltk.bigrams("Chief Executive Officer".split(), pad_right=True, 
                                                              pad_left=True)
cto_bigrams = nltk.bigrams("Chief Technology Officer".split(), pad_right=True, 
                                                               pad_left=True)

print ceo_bigrams
print cto_bigrams
print len(set(ceo_bigrams).intersection(set(cto_bigrams)))

Example 12. Clustering job titles using a greedy heuristic

In []:
import os
import csv
from nltk.metrics.distance import jaccard_distance

# XXX: Place your "Outlook CSV" formatted file of connections from 
# http://www.linkedin.com/people/export-settings at the following
# location: resources/ch03-linkedin/my_connections.csv

CSV_FILE = os.path.join("resources", "ch03-linkedin", 'my_connections.csv')

# Tweak this distance threshold and try different distance calculations 
# during experimentation
DISTANCE_THRESHOLD = 0.5
DISTANCE = jaccard_distance

def cluster_contacts_by_title(csv_file):

    transforms = [
        ('Sr.', 'Senior'),
        ('Sr', 'Senior'),
        ('Jr.', 'Junior'),
        ('Jr', 'Junior'),
        ('CEO', 'Chief Executive Officer'),
        ('COO', 'Chief Operating Officer'),
        ('CTO', 'Chief Technology Officer'),
        ('CFO', 'Chief Finance Officer'),
        ('VP', 'Vice President'),
        ]

    separators = ['/', 'and', '&']

    csvReader = csv.DictReader(open(csv_file), delimiter=',', quotechar='"')
    contacts = [row for row in csvReader]

    # Normalize and/or replace known abbreviations
    # and build up a list of common titles.

    all_titles = []
    for i, _ in enumerate(contacts):
        if contacts[i]['Job Title'] == '':
            contacts[i]['Job Titles'] = ['']
            continue
        titles = [contacts[i]['Job Title']]
        for title in titles:
            for separator in separators:
                if title.find(separator) >= 0:
                    titles.remove(title)
                    titles.extend([title.strip() for title in title.split(separator)
                                  if title.strip() != ''])

        for transform in transforms:
            titles = [title.replace(*transform) for title in titles]
        contacts[i]['Job Titles'] = titles
        all_titles.extend(titles)

    all_titles = list(set(all_titles))

    clusters = {}
    for title1 in all_titles:
        clusters[title1] = []
        for title2 in all_titles:
            if title2 in clusters[title1] or clusters.has_key(title2) and title1 \
                in clusters[title2]:
                continue
            distance = DISTANCE(set(title1.split()), set(title2.split()))

            if distance < DISTANCE_THRESHOLD:
                clusters[title1].append(title2)

    # Flatten out clusters

    clusters = [clusters[title] for title in clusters if len(clusters[title]) > 1]

    # Round up contacts who are in these clusters and group them together

    clustered_contacts = {}
    for cluster in clusters:
        clustered_contacts[tuple(cluster)] = []
        for contact in contacts:
            for title in contact['Job Titles']:
                if title in cluster:
                    clustered_contacts[tuple(cluster)].append('%s %s'
                            % (contact['First Name'], contact['Last Name']))

    return clustered_contacts


clustered_contacts = cluster_contacts_by_title(CSV_FILE)
print clustered_contacts
for titles in clustered_contacts:
    common_titles_heading = 'Common Titles: ' + ', '.join(titles)

    descriptive_terms = set(titles[0].split())
    for title in titles:
        descriptive_terms.intersection_update(set(title.split()))
    descriptive_terms_heading = 'Descriptive Terms: ' \
        + ', '.join(descriptive_terms)
    print descriptive_terms_heading
    print '-' * max(len(descriptive_terms_heading), len(common_titles_heading))
    print '\n'.join(clustered_contacts[titles])
    print

Incorporating random sampling can improve performance of the nested loops in Example 12

In []:
import os
import csv
import random
from nltk.metrics.distance import jaccard_distance

# XXX: Place your "Outlook CSV" formatted file of connections from 
# http://www.linkedin.com/people/export-settings at the following
# location: resources/ch03-linkedin/my_connections.csv

CSV_FILE = os.path.join("resources", "ch03-linkedin", 'my_connections.csv')

# Tweak this distance threshold and try different distance calculations 
# during experimentation
DISTANCE_THRESHOLD = 0.5
DISTANCE = jaccard_distance

# Adjust sample size as needed to reduce the runtime of the
# nested loop that invokes the DISTANCE function
SAMPLE_SIZE = 500

def cluster_contacts_by_title(csv_file):

    transforms = [
        ('Sr.', 'Senior'),
        ('Sr', 'Senior'),
        ('Jr.', 'Junior'),
        ('Jr', 'Junior'),
        ('CEO', 'Chief Executive Officer'),
        ('COO', 'Chief Operating Officer'),
        ('CTO', 'Chief Technology Officer'),
        ('CFO', 'Chief Finance Officer'),
        ('VP', 'Vice President'),
        ]

    separators = ['/', 'and', '&']

    csvReader = csv.DictReader(open(csv_file), delimiter=',', quotechar='"')
    contacts = [row for row in csvReader]

    # Normalize and/or replace known abbreviations
    # and build up list of common titles

    all_titles = []
    for i, _ in enumerate(contacts):
        if contacts[i]['Job Title'] == '':
            contacts[i]['Job Titles'] = ['']
            continue
        titles = [contacts[i]['Job Title']]
        for title in titles:
            for separator in separators:
                if title.find(separator) >= 0:
                    titles.remove(title)
                    titles.extend([title.strip() for title in title.split(separator)
                                  if title.strip() != ''])

        for transform in transforms:
            titles = [title.replace(*transform) for title in titles]
        contacts[i]['Job Titles'] = titles
        all_titles.extend(titles)

    all_titles = list(set(all_titles))
    clusters = {}
    for title1 in all_titles:
        clusters[title1] = []
        for sample in xrange(SAMPLE_SIZE):
            title2 = all_titles[random.randint(0, len(all_titles)-1)]
            if title2 in clusters[title1] or clusters.has_key(title2) and title1 \
                in clusters[title2]:
                continue
            distance = DISTANCE(set(title1.split()), set(title2.split()))
            if distance < DISTANCE_THRESHOLD:
                clusters[title1].append(title2)

    # Flatten out clusters

    clusters = [clusters[title] for title in clusters if len(clusters[title]) > 1]

    # Round up contacts who are in these clusters and group them together

    clustered_contacts = {}
    for cluster in clusters:
        clustered_contacts[tuple(cluster)] = []
        for contact in contacts:
            for title in contact['Job Titles']:
                if title in cluster:
                    clustered_contacts[tuple(cluster)].append('%s %s'
                            % (contact['First Name'], contact['Last Name']))

    return clustered_contacts


clustered_contacts = cluster_contacts_by_title(CSV_FILE)
print clustered_contacts
for titles in clustered_contacts:
    common_titles_heading = 'Common Titles: ' + ', '.join(titles)

    descriptive_terms = set(titles[0].split())
    for title in titles:
        descriptive_terms.intersection_update(set(title.split()))
    descriptive_terms_heading = 'Descriptive Terms: ' \
        + ', '.join(descriptive_terms)
    print descriptive_terms_heading
    print '-' * max(len(descriptive_terms_heading), len(common_titles_heading))
    print '\n'.join(clustered_contacts[titles])
    print

How to export data (contained in the "clustered contacts" variable) to power faceted display as outlined in Figure 3.

In []:
import json
import os
from IPython.display import IFrame
from IPython.core.display import display

data = {"label" : "name", "temp_items" : {}, "items" : []} 
for titles in clustered_contacts:
    descriptive_terms = set(titles[0].split())
    for title in titles:
        descriptive_terms.intersection_update(set(title.split()))
    descriptive_terms = ', '.join(descriptive_terms)

    if data['temp_items'].has_key(descriptive_terms):
        data['temp_items'][descriptive_terms].extend([{'name' : cc } for cc 
            in clustered_contacts[titles]])
    else:
        data['temp_items'][descriptive_terms] = [{'name' : cc } for cc 
            in clustered_contacts[titles]]

for descriptive_terms in data['temp_items']:
    data['items'].append({"name" : "%s (%s)" % (descriptive_terms, 
        len(data['temp_items'][descriptive_terms]),),
                              "children" : [i for i in 
                              data['temp_items'][descriptive_terms]]})

del data['temp_items']

# Open the template and substitute the data

TEMPLATE = 'resources/ch03-linkedin/viz/dojo_tree.html.template'                                                
OUT = 'resources/ch03-linkedin/viz/dojo_tree.html'

viz_file = 'files/resources/ch03-linkedin/viz/dojo_tree.html'

t = open(TEMPLATE).read()
f = open(OUT, 'w')
f.write(t % json.dumps(data, indent=4))
f.close()

# IPython Notebook can serve files and display them into
# inline frames. Prepend the path with the 'files' prefix

display(IFrame(viz_file, '400px', '600px'))

How to export data to power a dendogram and node-link tree visualization as outlined in Figure 4.

In []:
import os
import csv
import random
from nltk.metrics.distance import jaccard_distance
from cluster import HierarchicalClustering

# XXX: Place your "Outlook CSV" formatted file of connections from 
# http://www.linkedin.com/people/export-settings at the following
# location: resources/ch03-linkedin/my_connections.csv

CSV_FILE = os.path.join("resources", "ch03-linkedin", 'my_connections.csv')

OUT_FILE = 'resources/ch03-linkedin/viz/d3-data.json'

# Tweak this distance threshold and try different distance calculations 
# during experimentation
DISTANCE_THRESHOLD = 0.5
DISTANCE = jaccard_distance

# Adjust sample size as needed to reduce the runtime of the
# nested loop that invokes the DISTANCE function
SAMPLE_SIZE = 500

def cluster_contacts_by_title(csv_file):

    transforms = [
        ('Sr.', 'Senior'),
        ('Sr', 'Senior'),
        ('Jr.', 'Junior'),
        ('Jr', 'Junior'),
        ('CEO', 'Chief Executive Officer'),
        ('COO', 'Chief Operating Officer'),
        ('CTO', 'Chief Technology Officer'),
        ('CFO', 'Chief Finance Officer'),
        ('VP', 'Vice President'),
        ]

    separators = ['/', 'and', '&']

    csvReader = csv.DictReader(open(csv_file), delimiter=',', quotechar='"')
    contacts = [row for row in csvReader]

    # Normalize and/or replace known abbreviations
    # and build up list of common titles

    all_titles = []
    for i, _ in enumerate(contacts):
        if contacts[i]['Job Title'] == '':
            contacts[i]['Job Titles'] = ['']
            continue
        titles = [contacts[i]['Job Title']]
        for title in titles:
            for separator in separators:
                if title.find(separator) >= 0:
                    titles.remove(title)
                    titles.extend([title.strip() for title in title.split(separator)
                                  if title.strip() != ''])

        for transform in transforms:
            titles = [title.replace(*transform) for title in titles]
        contacts[i]['Job Titles'] = titles
        all_titles.extend(titles)

    all_titles = list(set(all_titles))
    
    # Define a scoring function
    def score(title1, title2): 
        return DISTANCE(set(title1.split()), set(title2.split()))

    # Feed the class your data and the scoring function
    hc = HierarchicalClustering(all_titles, score)

    # Cluster the data according to a distance threshold
    clusters = hc.getlevel(DISTANCE_THRESHOLD)

    # Remove singleton clusters
    clusters = [c for c in clusters if len(c) > 1]

    # Round up contacts who are in these clusters and group them together

    clustered_contacts = {}
    for cluster in clusters:
        clustered_contacts[tuple(cluster)] = []
        for contact in contacts:
            for title in contact['Job Titles']:
                if title in cluster:
                    clustered_contacts[tuple(cluster)].append('%s %s'
                            % (contact['First Name'], contact['Last Name']))

    return clustered_contacts

def display_output(clustered_contacts):
    
    for titles in clustered_contacts:
        common_titles_heading = 'Common Titles: ' + ', '.join(titles)

        descriptive_terms = set(titles[0].split())
        for title in titles:
            descriptive_terms.intersection_update(set(title.split()))
        descriptive_terms_heading = 'Descriptive Terms: ' \
            + ', '.join(descriptive_terms)
        print descriptive_terms_heading
        print '-' * max(len(descriptive_terms_heading), len(common_titles_heading))
        print '\n'.join(clustered_contacts[titles])
        print

def write_d3_json_output(clustered_contacts):
    
    json_output = {'name' : 'My LinkedIn', 'children' : []}

    for titles in clustered_contacts:

        descriptive_terms = set(titles[0].split())
        for title in titles:
            descriptive_terms.intersection_update(set(title.split()))

        json_output['children'].append({'name' : ', '.join(descriptive_terms)[:30], 
                                    'children' : [ {'name' : c.decode('utf-8', 'replace')} for c in clustered_contacts[titles] ] } )
    
        f = open(OUT_FILE, 'w')
        f.write(json.dumps(json_output, indent=1))
        f.close()
    
clustered_contacts = cluster_contacts_by_title(CSV_FILE)
display_output(clustered_contacts)
write_d3_json_output(clustered_contacts)
Once you've run the code and produced the output for the dendogram and node-link tree visualizations, here's one way to serve it.

In []:
import os
from IPython.display import IFrame
from IPython.core.display import display

# IPython Notebook can serve files and display them into
# inline frames. Prepend the path with the 'files' prefix

viz_file = 'files/resources/ch03-linkedin/viz/node_link_tree.html'

# XXX: Another visualization you could try:
#viz_file = 'files/resources/ch03-linkedin/viz/dendogram.html'

display(IFrame(viz_file, '100%', '600px'))

Example 13. Clustering your LinkedIn professional network based upon the locations of your connections and emitting KML output for visualization with Google Earth

In []:
import os
import sys
import json
from urllib2 import HTTPError
from geopy import geocoders
from cluster import KMeansClustering, centroid

# A helper function to munge data and build up an XML tree.
# It references some code tucked away in another directory, so we have to
# add that directory to the PYTHONPATH for it to be picked up.
sys.path.append(os.path.join(os.getcwd(), "resources", "ch03-linkedin"))
from linkedin__kml_utility import createKML

# XXX: Try different values for K to see the difference in clusters that emerge

K = 3

# XXX: Get an API key and pass it in here. See https://www.bingmapsportal.com.
GEO_API_KEY = ''
g = geocoders.Bing(GEO_API_KEY)

# Load this data from where you've previously stored it

CONNECTIONS_DATA = 'resources/ch03-linkedin/linkedin_connections.json'

OUT_FILE = "resources/ch03-linkedin/viz/linkedin_clusters_kmeans.kml"

# Open up your saved connections with extended profile information
# or fetch them again from LinkedIn if you prefer

connections = json.loads(open(CONNECTIONS_DATA).read())['values']

locations = [c['location']['name'] for c in connections if c.has_key('location')]

# Some basic transforms may be necessary for geocoding services to function properly
# Here are a couple that seem to help.

transforms = [('Greater ', ''), (' Area', '')]

# Step 1 - Tally the frequency of each location

coords_freqs = {}
for location in locations:

    if not c.has_key('location'): continue
    
    # Avoid unnecessary I/O and geo requests by building up a cache

    if coords_freqs.has_key(location):
        coords_freqs[location][1] += 1
        continue
    transformed_location = location

    for transform in transforms:
        transformed_location = transformed_location.replace(*transform)
        
        # Handle potential I/O errors with a retry pattern...
        
        while True:
            num_errors = 0
            try:
                results = g.geocode(transformed_location, exactly_one=False)
                break
            except HTTPError, e:
                num_errors += 1
                if num_errors >= 3:
                    sys.exit()
                print >> sys.stderr, e
                print >> sys.stderr, 'Encountered an urllib2 error. Trying again...'
                
        for result in results:
            # Each result is of the form ("Description", (X,Y))
            coords_freqs[location] = [result[1], 1]
            break # Disambiguation strategy is "pick first"

# Step 2 - Build up data structure for converting locations to KML            
            
# Here, you could optionally segment locations by continent or country
# so as to avoid potentially finding a mean in the middle of the ocean.
# The k-means algorithm will expect distinct points for each contact, so
# build out an expanded list to pass it.

expanded_coords = []
for label in coords_freqs:
    # Flip lat/lon for Google Earth
    ((lat, lon), f) = coords_freqs[label]
    expanded_coords.append((label, [(lon, lat)] * f))

# No need to clutter the map with unnecessary placemarks...

kml_items = [{'label': label, 'coords': '%s,%s' % coords[0]} for (label,
             coords) in expanded_coords]

# It would also be helpful to include names of your contacts on the map

for item in kml_items:
    item['contacts'] = '\n'.join(['%s %s.' % (c['firstName'], c['lastName'])
        for c in connections if c.has_key('location') and 
                                c['location']['name'] == item['label']])

# Step 3 - Cluster locations and extend the KML data structure with centroids
    
cl = KMeansClustering([coords for (label, coords_list) in expanded_coords
                      for coords in coords_list])

centroids = [{'label': 'CENTROID', 'coords': '%s,%s' % centroid(c)} for c in
             cl.getclusters(K)]

kml_items.extend(centroids)

# Step 4 - Create the final KML output and write it to a file

kml = createKML(kml_items)

f = open(OUT_FILE, 'w')
f.write(kml)
f.close()

print 'Data written to ' + OUT