Mathematica Gnuplot Integration
Basic examples
The gnuPlot function works (to some extend) analogous to the Mathematica Plot function.
The default plot variable is x and the default interval is from -5 to +5.
![]()
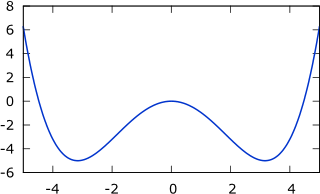
User defined variables and intervals can be given as second argument.
The option PlotStyle is used to add additional gnuplot commands before the automatically generated plot command.
![]()
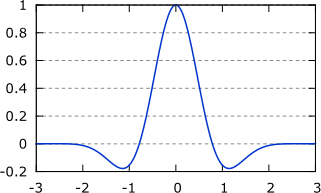
A set of functions can be given as first argument.
The third argument of gnuPlot is used to overwrite the default plot command.
The labels #1, #2, .. are used to identify the different data sets / functions. They are replaced internally by the respective file names.
![]()
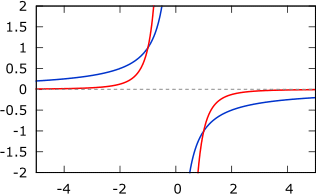
Latex terminal
The cairolatex terminal can be used to set labels with Latex. Special characters have to be escaped.
The PlotSize option is used to modify the gnuplot output size.

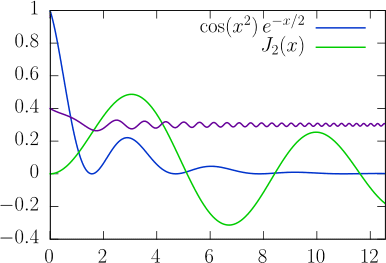
The LatexStyle option can be used to supply additional Tex commands. This can be used to change the font family, for example.

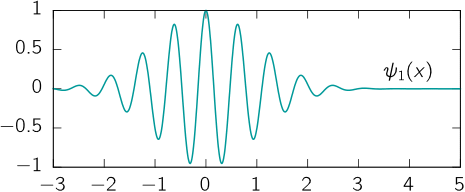
List plots
List plots work in the same way as the Mathematica ListPlot function.
Here, gnuplots boxes option is used to create a bar plot.
![]()
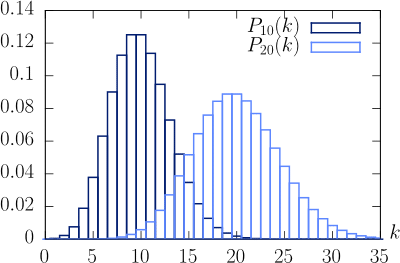
Combined Data + Analytical plots
The gnuData helper function can be used to quicky create datasets from any analytic function.
Internally, the function gnuPlot uses gnuListPlot in combination with gnuData.
![]()
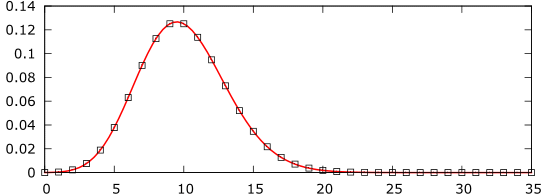
Using gnuplots ‘multiplot’ feature
Not a feature of the script, but an easy way to use gnuplots extended features.


Combining with Mathematica Graphics functions
The graphs are usual Mathematica Graphics objects and can be manipulated
![]()

The PNG Terminal
PNG output works in the same way as PDF / Latex, but the size / linewidth and font options should be modified
![]()
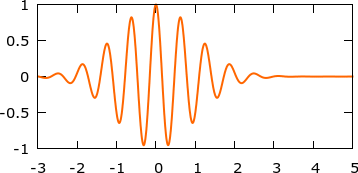
3D plots
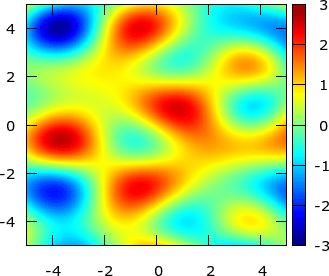
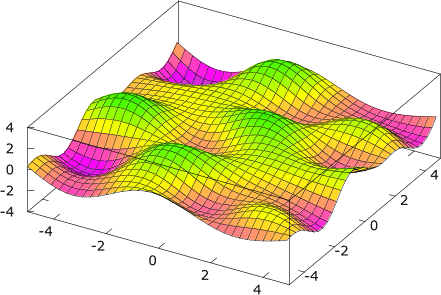
The gnuListPlot command can be used to create 3D plots as well.

